Peterborough United, by the numbers
Every game,on paper.
Every League One game since January 2023, broken down from the match data — shots, chances, momentum, and what the result should have been. Now tracking Robbie Savage's promise of attacking football, game by game.
2026-27 · League One so far
Season so far
13 games · W2 D4 L7 · season averages per game. "Last game" is Luton (H) and the badge is how much it moved the average.
Bars: each game this season, oldest → newest (blue win · white draw · grey loss). Line: the running season average. Dashed line: the average per game of the league's current top six (Huddersfield, Stockport County, Oxford Utd, Luton, Plymouth, Reading), from the league table and league-wide team stats. Shots and counter-attacks have no league-wide figures.
2026-27 · Savage's numbers, projected
The Savage forecast
How the results compare with the chances under Robbie Savage, what those chances say about every league game left, and where that would finish.
5 points from 5 league games under Savage; the chances they made and allowed were worth 6.5, so about 1.5 fewer than the numbers deserved.
The games left
Win · draw · loss chances from Savage's averages against each opponent's record.
| 14 Nov 26 postponed | Oxford Utd (H) | 31% | Lean loss | |
| 21 Nov 26 | Plymouth (A) | 29% | Lean loss | |
| 28 Nov 26 | Cambridge (H) | 41% | Toss-up | |
| 1 Dec 26 | Leyton Orient (A) | 26% | Lean loss | |
| 12 Dec 26 | Barnsley (H) | 50% | Should win |
All 33 games
| 15 Dec 26 | Notts County (H) | 41% | Toss-up | |
| 19 Dec 26 | Wigan (A) | 40% | Toss-up | |
| 26 Dec 26 | Wycombe (H) | 43% | Toss-up | |
| 29 Dec 26 | Reading (A) | 22% | Should lose | |
| 1 Jan 27 | Wimbledon (A) | 41% | Toss-up | |
| 9 Jan 27 | Wigan (H) | 50% | Should win | |
| 16 Jan 27 | Burton (A) | 33% | Toss-up | |
| 19 Jan 27 | Huddersfield (H) | 27% | Lean loss | |
| 23 Jan 27 | Bromley (H) | 59% | Should win | |
| 30 Jan 27 | Luton (A) | 26% | Should lose | |
| 6 Feb 27 | Blackpool (H) | 45% | Lean win | |
| 9 Feb 27 | Stevenage (A) | 27% | Lean loss | |
| 13 Feb 27 | Sheff Wed (A) | 24% | Should lose | |
| 20 Feb 27 | MK Dons (H) | 39% | Toss-up | |
| 27 Feb 27 | Cambridge (A) | 31% | Lean loss | |
| 6 Mar 27 | Bradford (H) | 36% | Toss-up | |
| 13 Mar 27 | Mansfield (A) | 29% | Lean loss | |
| 20 Mar 27 | Plymouth (H) | 39% | Toss-up | |
| 26 Mar 27 | Wimbledon (H) | 51% | Should win | |
| 29 Mar 27 | Wycombe (A) | 32% | Lean loss | |
| 3 Apr 27 | Reading (H) | 30% | Lean loss | |
| 10 Apr 27 | Barnsley (A) | 40% | Toss-up | |
| 13 Apr 27 | Stockport County (H) | 31% | Lean loss | |
| 17 Apr 27 | Doncaster (A) | 37% | Toss-up | |
| 24 Apr 27 | Leicester (H) | 38% | Toss-up | |
| 27 Apr 27 | Notts County (A) | 31% | Lean loss | |
| 1 May 27 | Oxford Utd (A) | 23% | Should lose | |
| 8 May 27 | Leyton Orient (H) | 35% | Toss-up |
Where that finishes
Share of 10,000 simulated seasons finishing in each place. most likely (18th) · automatic promotion · play-offs · relegation.
Most likely 18th, 53 points (80% between 44 and 63). Relegation chance: 18%.
Status: points won against the points each game's chances were worth (xG as Poisson scorelines); more than 0.3 a game either side is out- or under-performing. Projection: Savage's League One averages so far (5 games), 70% chances (xG) and 30% actual goals, pulled toward the league average as if 10 average games came first so a short run doesn't count for too much; scaled by each opponent's scoring and conceding (halfway to the league average) with a home/away edge; other sides carry on at their points per game, a third of the way back to average. League games only.
2026-27 · 18 competitive games
Players of the season
The best of Posh's squad so far, ranked by average match rating for everyone with at least 5 full games' worth of minutes, and every number we hold for each player. Tap a player for their game-by-game record.
| Player | Apps | Mins | Rating | G | A | xG | xA | xG+xA/90 | Shots | Chances | Box | Dribbles | Pass % | Final 3rd | Long | Touches | Tkl | Int | Rec | Clr | Duels | Aerials | Saves | Prevented | ||||||||||||||||||||||||||||||||||||||||||||||||||||||||||||||||||||||||||||||||||||||||||||||||||||||||||||||||||||||||||||||||||||||||||||||||||||||||||||||||||||||||||||||||||||||||||||||||||||||||||||||||||||||||||||||||||||||||||||||||||||||||||||||||||||||||||||||||||||||||||||||||||||||||||||||||||||||||||||||||||||||||||||||||||||||
|---|---|---|---|---|---|---|---|---|---|---|---|---|---|---|---|---|---|---|---|---|---|---|---|---|---|---|---|---|---|---|---|---|---|---|---|---|---|---|---|---|---|---|---|---|---|---|---|---|---|---|---|---|---|---|---|---|---|---|---|---|---|---|---|---|---|---|---|---|---|---|---|---|---|---|---|---|---|---|---|---|---|---|---|---|---|---|---|---|---|---|---|---|---|---|---|---|---|---|---|---|---|---|---|---|---|---|---|---|---|---|---|---|---|---|---|---|---|---|---|---|---|---|---|---|---|---|---|---|---|---|---|---|---|---|---|---|---|---|---|---|---|---|---|---|---|---|---|---|---|---|---|---|---|---|---|---|---|---|---|---|---|---|---|---|---|---|---|---|---|---|---|---|---|---|---|---|---|---|---|---|---|---|---|---|---|---|---|---|---|---|---|---|---|---|---|---|---|---|---|---|---|---|---|---|---|---|---|---|---|---|---|---|---|---|---|---|---|---|---|---|---|---|---|---|---|---|---|---|---|---|---|---|---|---|---|---|---|---|---|---|---|---|---|---|---|---|---|---|---|---|---|---|---|---|---|---|---|---|---|---|---|---|---|---|---|---|---|---|---|---|---|---|---|---|---|---|---|---|---|---|---|---|---|---|---|---|---|---|---|---|---|---|---|---|---|---|---|---|---|---|---|---|---|---|---|---|---|---|---|---|---|---|---|---|---|---|---|---|---|---|---|---|---|---|---|---|---|---|---|---|---|---|---|---|---|---|---|---|---|---|---|---|---|---|---|---|---|---|---|---|---|---|---|---|---|---|---|---|---|---|---|---|---|---|---|---|
| Owura EdwardsFWD | 1414 | 1,035 | 7.40 | 3 | 2 | 1.7 | 3.4 | 0.44 | 125 | 327 | 83 | 2243% | 73% | 17 | 1152% | 572 | 26 | 1 | 49 | 5 | 8249% | 1141% | – | – | ||||||||||||||||||||||||||||||||||||||||||||||||||||||||||||||||||||||||||||||||||||||||||||||||||||||||||||||||||||||||||||||||||||||||||||||||||||||||||||||||||||||||||||||||||||||||||||||||||||||||||||||||||||||||||||||||||||||||||||||||||||||||||||||||||||||||||||||||||||||||||||||||||||||||||||||||||||||||||||||||||||||||||||||||||||||
| ||||||||||||||||||||||||||||||||||||||||||||||||||||||||||||||||||||||||||||||||||||||||||||||||||||||||||||||||||||||||||||||||||||||||||||||||||||||||||||||||||||||||||||||||||||||||||||||||||||||||||||||||||||||||||||||||||||||||||||||||||||||||||||||||||||||||||||||||||||||||||||||||||||||||||||||||||||||||||||||||||||||||||||||||||||||||||||||||||||||||||||||
| Harley MillsDEF | 1716 | 1,432 | 7.21 | 0 | 4 | 0.5 | 2.6 | 0.20 | 161 | 253 | 25 | 433% | 71% | 213 | 6736% | 1,382 | 43 | 20 | 84 | 49 | 8960% | 1950% | – | – | ||||||||||||||||||||||||||||||||||||||||||||||||||||||||||||||||||||||||||||||||||||||||||||||||||||||||||||||||||||||||||||||||||||||||||||||||||||||||||||||||||||||||||||||||||||||||||||||||||||||||||||||||||||||||||||||||||||||||||||||||||||||||||||||||||||||||||||||||||||||||||||||||||||||||||||||||||||||||||||||||||||||||||||||||||||||
| ||||||||||||||||||||||||||||||||||||||||||||||||||||||||||||||||||||||||||||||||||||||||||||||||||||||||||||||||||||||||||||||||||||||||||||||||||||||||||||||||||||||||||||||||||||||||||||||||||||||||||||||||||||||||||||||||||||||||||||||||||||||||||||||||||||||||||||||||||||||||||||||||||||||||||||||||||||||||||||||||||||||||||||||||||||||||||||||||||||||||||||||
| Ben WoodsMID | 117 | 599 | 7.19 | 2 | 2 | 1.6 | 0.7 | 0.35 | 184 | 94 | 12 | 444% | 84% | 61 | 964% | 439 | 12 | 4 | 35 | 8 | 2643% | 643% | – | – | ||||||||||||||||||||||||||||||||||||||||||||||||||||||||||||||||||||||||||||||||||||||||||||||||||||||||||||||||||||||||||||||||||||||||||||||||||||||||||||||||||||||||||||||||||||||||||||||||||||||||||||||||||||||||||||||||||||||||||||||||||||||||||||||||||||||||||||||||||||||||||||||||||||||||||||||||||||||||||||||||||||||||||||||||||||||
| ||||||||||||||||||||||||||||||||||||||||||||||||||||||||||||||||||||||||||||||||||||||||||||||||||||||||||||||||||||||||||||||||||||||||||||||||||||||||||||||||||||||||||||||||||||||||||||||||||||||||||||||||||||||||||||||||||||||||||||||||||||||||||||||||||||||||||||||||||||||||||||||||||||||||||||||||||||||||||||||||||||||||||||||||||||||||||||||||||||||||||||||
| Harry LeonardFWD | 1717 | 1,443 | 7.09 | 7 | 2 | 10.2 | 1.0 | 0.70 | 6523 | 193 | 106 | 847% | 68% | 20 | 571% | 433 | 5 | 0 | 22 | 19 | 7236% | 3631% | – | – | ||||||||||||||||||||||||||||||||||||||||||||||||||||||||||||||||||||||||||||||||||||||||||||||||||||||||||||||||||||||||||||||||||||||||||||||||||||||||||||||||||||||||||||||||||||||||||||||||||||||||||||||||||||||||||||||||||||||||||||||||||||||||||||||||||||||||||||||||||||||||||||||||||||||||||||||||||||||||||||||||||||||||||||||||||||||
| ||||||||||||||||||||||||||||||||||||||||||||||||||||||||||||||||||||||||||||||||||||||||||||||||||||||||||||||||||||||||||||||||||||||||||||||||||||||||||||||||||||||||||||||||||||||||||||||||||||||||||||||||||||||||||||||||||||||||||||||||||||||||||||||||||||||||||||||||||||||||||||||||||||||||||||||||||||||||||||||||||||||||||||||||||||||||||||||||||||||||||||||
| Harry AshfieldMID | 128 | 618 | 7.00 | 2 | 0 | 0.8 | 0.2 | 0.15 | 165 | 42 | 22 | 655% | 83% | 43 | 1146% | 425 | 16 | 9 | 35 | 15 | 4655% | 1243% | – | – | ||||||||||||||||||||||||||||||||||||||||||||||||||||||||||||||||||||||||||||||||||||||||||||||||||||||||||||||||||||||||||||||||||||||||||||||||||||||||||||||||||||||||||||||||||||||||||||||||||||||||||||||||||||||||||||||||||||||||||||||||||||||||||||||||||||||||||||||||||||||||||||||||||||||||||||||||||||||||||||||||||||||||||||||||||||||
| ||||||||||||||||||||||||||||||||||||||||||||||||||||||||||||||||||||||||||||||||||||||||||||||||||||||||||||||||||||||||||||||||||||||||||||||||||||||||||||||||||||||||||||||||||||||||||||||||||||||||||||||||||||||||||||||||||||||||||||||||||||||||||||||||||||||||||||||||||||||||||||||||||||||||||||||||||||||||||||||||||||||||||||||||||||||||||||||||||||||||||||||
| Lucca MendonçaDEF | 119 | 879 | 6.95 | 0 | 0 | 0.1 | 0.1 | 0.02 | 30 | 10 | 6 | 0– | 80% | 88 | 2227% | 793 | 29 | 15 | 56 | 62 | 6854% | 2437% | – | – | ||||||||||||||||||||||||||||||||||||||||||||||||||||||||||||||||||||||||||||||||||||||||||||||||||||||||||||||||||||||||||||||||||||||||||||||||||||||||||||||||||||||||||||||||||||||||||||||||||||||||||||||||||||||||||||||||||||||||||||||||||||||||||||||||||||||||||||||||||||||||||||||||||||||||||||||||||||||||||||||||||||||||||||||||||||||
| ||||||||||||||||||||||||||||||||||||||||||||||||||||||||||||||||||||||||||||||||||||||||||||||||||||||||||||||||||||||||||||||||||||||||||||||||||||||||||||||||||||||||||||||||||||||||||||||||||||||||||||||||||||||||||||||||||||||||||||||||||||||||||||||||||||||||||||||||||||||||||||||||||||||||||||||||||||||||||||||||||||||||||||||||||||||||||||||||||||||||||||||
| Alex BassGK | 1818 | 1,620 | 6.92 | 0 | 0 | 0.0 | 0.1 | 0.00 | 00 | 10 | 0 | 1100% | 55% | 196 | 10024% | 949 | 1 | 1 | 230 | 18 | 1091% | 4100% | 632 CS | 2.15 | ||||||||||||||||||||||||||||||||||||||||||||||||||||||||||||||||||||||||||||||||||||||||||||||||||||||||||||||||||||||||||||||||||||||||||||||||||||||||||||||||||||||||||||||||||||||||||||||||||||||||||||||||||||||||||||||||||||||||||||||||||||||||||||||||||||||||||||||||||||||||||||||||||||||||||||||||||||||||||||||||||||||||||||||||||||||
| ||||||||||||||||||||||||||||||||||||||||||||||||||||||||||||||||||||||||||||||||||||||||||||||||||||||||||||||||||||||||||||||||||||||||||||||||||||||||||||||||||||||||||||||||||||||||||||||||||||||||||||||||||||||||||||||||||||||||||||||||||||||||||||||||||||||||||||||||||||||||||||||||||||||||||||||||||||||||||||||||||||||||||||||||||||||||||||||||||||||||||||||
| Ethan WilliamsFWD | 1611 | 992 | 6.88 | 0 | 0 | 2.4 | 1.5 | 0.35 | 3212 | 203 | 38 | 1454% | 71% | 41 | 1445% | 554 | 23 | 10 | 49 | 5 | 5144% | 217% | – | – | ||||||||||||||||||||||||||||||||||||||||||||||||||||||||||||||||||||||||||||||||||||||||||||||||||||||||||||||||||||||||||||||||||||||||||||||||||||||||||||||||||||||||||||||||||||||||||||||||||||||||||||||||||||||||||||||||||||||||||||||||||||||||||||||||||||||||||||||||||||||||||||||||||||||||||||||||||||||||||||||||||||||||||||||||||||||
| ||||||||||||||||||||||||||||||||||||||||||||||||||||||||||||||||||||||||||||||||||||||||||||||||||||||||||||||||||||||||||||||||||||||||||||||||||||||||||||||||||||||||||||||||||||||||||||||||||||||||||||||||||||||||||||||||||||||||||||||||||||||||||||||||||||||||||||||||||||||||||||||||||||||||||||||||||||||||||||||||||||||||||||||||||||||||||||||||||||||||||||||
| Liam KellyMID | 1614 | 1,167 | 6.85 | 0 | 0 | 0.4 | 1.4 | 0.13 | 122 | 122 | 6 | 655% | 88% | 121 | 3138% | 999 | 21 | 12 | 87 | 8 | 4349% | 429% | – | – | ||||||||||||||||||||||||||||||||||||||||||||||||||||||||||||||||||||||||||||||||||||||||||||||||||||||||||||||||||||||||||||||||||||||||||||||||||||||||||||||||||||||||||||||||||||||||||||||||||||||||||||||||||||||||||||||||||||||||||||||||||||||||||||||||||||||||||||||||||||||||||||||||||||||||||||||||||||||||||||||||||||||||||||||||||||||
| ||||||||||||||||||||||||||||||||||||||||||||||||||||||||||||||||||||||||||||||||||||||||||||||||||||||||||||||||||||||||||||||||||||||||||||||||||||||||||||||||||||||||||||||||||||||||||||||||||||||||||||||||||||||||||||||||||||||||||||||||||||||||||||||||||||||||||||||||||||||||||||||||||||||||||||||||||||||||||||||||||||||||||||||||||||||||||||||||||||||||||||||
| Carl JohnstonDEF | 1413 | 1,064 | 6.81 | 0 | 0 | 0.4 | 0.9 | 0.11 | 40 | 91 | 7 | 542% | 80% | 110 | 1323% | 922 | 23 | 12 | 59 | 27 | 5758% | 1342% | – | – | ||||||||||||||||||||||||||||||||||||||||||||||||||||||||||||||||||||||||||||||||||||||||||||||||||||||||||||||||||||||||||||||||||||||||||||||||||||||||||||||||||||||||||||||||||||||||||||||||||||||||||||||||||||||||||||||||||||||||||||||||||||||||||||||||||||||||||||||||||||||||||||||||||||||||||||||||||||||||||||||||||||||||||||||||||||||
| ||||||||||||||||||||||||||||||||||||||||||||||||||||||||||||||||||||||||||||||||||||||||||||||||||||||||||||||||||||||||||||||||||||||||||||||||||||||||||||||||||||||||||||||||||||||||||||||||||||||||||||||||||||||||||||||||||||||||||||||||||||||||||||||||||||||||||||||||||||||||||||||||||||||||||||||||||||||||||||||||||||||||||||||||||||||||||||||||||||||||||||||
| James DornellyDEF | 96 | 565 | 6.76 | 0 | 1 | 0.1 | 1.2 | 0.20 | 10 | 22 | 6 | 00% | 82% | 32 | 627% | 409 | 9 | 6 | 13 | 24 | 2447% | 1343% | – | – | ||||||||||||||||||||||||||||||||||||||||||||||||||||||||||||||||||||||||||||||||||||||||||||||||||||||||||||||||||||||||||||||||||||||||||||||||||||||||||||||||||||||||||||||||||||||||||||||||||||||||||||||||||||||||||||||||||||||||||||||||||||||||||||||||||||||||||||||||||||||||||||||||||||||||||||||||||||||||||||||||||||||||||||||||||||||
| ||||||||||||||||||||||||||||||||||||||||||||||||||||||||||||||||||||||||||||||||||||||||||||||||||||||||||||||||||||||||||||||||||||||||||||||||||||||||||||||||||||||||||||||||||||||||||||||||||||||||||||||||||||||||||||||||||||||||||||||||||||||||||||||||||||||||||||||||||||||||||||||||||||||||||||||||||||||||||||||||||||||||||||||||||||||||||||||||||||||||||||||
| Harrison JonesMID | 127 | 615 | 6.69 | 1 | 0 | 0.9 | 0.4 | 0.19 | 133 | 50 | 19 | 240% | 83% | 30 | 556% | 406 | 11 | 13 | 25 | 11 | 2840% | 1137% | – | – | ||||||||||||||||||||||||||||||||||||||||||||||||||||||||||||||||||||||||||||||||||||||||||||||||||||||||||||||||||||||||||||||||||||||||||||||||||||||||||||||||||||||||||||||||||||||||||||||||||||||||||||||||||||||||||||||||||||||||||||||||||||||||||||||||||||||||||||||||||||||||||||||||||||||||||||||||||||||||||||||||||||||||||||||||||||||
| ||||||||||||||||||||||||||||||||||||||||||||||||||||||||||||||||||||||||||||||||||||||||||||||||||||||||||||||||||||||||||||||||||||||||||||||||||||||||||||||||||||||||||||||||||||||||||||||||||||||||||||||||||||||||||||||||||||||||||||||||||||||||||||||||||||||||||||||||||||||||||||||||||||||||||||||||||||||||||||||||||||||||||||||||||||||||||||||||||||||||||||||
| Josh FeeneyDEF | 1111 | 990 | 6.69 | 0 | 0 | 0.2 | 0.1 | 0.03 | 30 | 30 | 5 | 1100% | 86% | 77 | 2938% | 868 | 9 | 15 | 31 | 90 | 7667% | 5768% | – | – | ||||||||||||||||||||||||||||||||||||||||||||||||||||||||||||||||||||||||||||||||||||||||||||||||||||||||||||||||||||||||||||||||||||||||||||||||||||||||||||||||||||||||||||||||||||||||||||||||||||||||||||||||||||||||||||||||||||||||||||||||||||||||||||||||||||||||||||||||||||||||||||||||||||||||||||||||||||||||||||||||||||||||||||||||||||||
| ||||||||||||||||||||||||||||||||||||||||||||||||||||||||||||||||||||||||||||||||||||||||||||||||||||||||||||||||||||||||||||||||||||||||||||||||||||||||||||||||||||||||||||||||||||||||||||||||||||||||||||||||||||||||||||||||||||||||||||||||||||||||||||||||||||||||||||||||||||||||||||||||||||||||||||||||||||||||||||||||||||||||||||||||||||||||||||||||||||||||||||||
| Danny OrmerodFWD | 143 | 495 | 6.67 | 2 | 1 | 2.9 | 0.9 | 0.68 | 153 | 110 | 26 | 562% | 79% | 7 | 150% | 149 | 2 | 2 | 7 | 3 | 2231% | 1022% | – | – | ||||||||||||||||||||||||||||||||||||||||||||||||||||||||||||||||||||||||||||||||||||||||||||||||||||||||||||||||||||||||||||||||||||||||||||||||||||||||||||||||||||||||||||||||||||||||||||||||||||||||||||||||||||||||||||||||||||||||||||||||||||||||||||||||||||||||||||||||||||||||||||||||||||||||||||||||||||||||||||||||||||||||||||||||||||||
| ||||||||||||||||||||||||||||||||||||||||||||||||||||||||||||||||||||||||||||||||||||||||||||||||||||||||||||||||||||||||||||||||||||||||||||||||||||||||||||||||||||||||||||||||||||||||||||||||||||||||||||||||||||||||||||||||||||||||||||||||||||||||||||||||||||||||||||||||||||||||||||||||||||||||||||||||||||||||||||||||||||||||||||||||||||||||||||||||||||||||||||||
| David OkagbueDEF | 98 | 766 | 6.61 | 0 | 0 | 0.3 | 0.1 | 0.04 | 41 | 00 | 8 | 1100% | 85% | 48 | 2945% | 616 | 6 | 7 | 22 | 65 | 4556% | 3456% | – | – | ||||||||||||||||||||||||||||||||||||||||||||||||||||||||||||||||||||||||||||||||||||||||||||||||||||||||||||||||||||||||||||||||||||||||||||||||||||||||||||||||||||||||||||||||||||||||||||||||||||||||||||||||||||||||||||||||||||||||||||||||||||||||||||||||||||||||||||||||||||||||||||||||||||||||||||||||||||||||||||||||||||||||||||||||||||||
| ||||||||||||||||||||||||||||||||||||||||||||||||||||||||||||||||||||||||||||||||||||||||||||||||||||||||||||||||||||||||||||||||||||||||||||||||||||||||||||||||||||||||||||||||||||||||||||||||||||||||||||||||||||||||||||||||||||||||||||||||||||||||||||||||||||||||||||||||||||||||||||||||||||||||||||||||||||||||||||||||||||||||||||||||||||||||||||||||||||||||||||||
| Boluwatife ShofowokeFWD | 1813 | 1,183 | 6.53 | 1 | 1 | 2.1 | 2.4 | 0.34 | 115 | 233 | 74 | 1937% | 79% | 10 | 00% | 496 | 12 | 2 | 41 | 6 | 4228% | 418% | – | – | ||||||||||||||||||||||||||||||||||||||||||||||||||||||||||||||||||||||||||||||||||||||||||||||||||||||||||||||||||||||||||||||||||||||||||||||||||||||||||||||||||||||||||||||||||||||||||||||||||||||||||||||||||||||||||||||||||||||||||||||||||||||||||||||||||||||||||||||||||||||||||||||||||||||||||||||||||||||||||||||||||||||||||||||||||||||
| ||||||||||||||||||||||||||||||||||||||||||||||||||||||||||||||||||||||||||||||||||||||||||||||||||||||||||||||||||||||||||||||||||||||||||||||||||||||||||||||||||||||||||||||||||||||||||||||||||||||||||||||||||||||||||||||||||||||||||||||||||||||||||||||||||||||||||||||||||||||||||||||||||||||||||||||||||||||||||||||||||||||||||||||||||||||||||||||||||||||||||||||
| Brandon KhelaMID | 148 | 740 | 6.53 | 0 | 0 | 0.9 | 0.2 | 0.14 | 144 | 61 | 14 | 873% | 79% | 59 | 1033% | 496 | 15 | 7 | 41 | 3 | 3641% | 526% | – | – | ||||||||||||||||||||||||||||||||||||||||||||||||||||||||||||||||||||||||||||||||||||||||||||||||||||||||||||||||||||||||||||||||||||||||||||||||||||||||||||||||||||||||||||||||||||||||||||||||||||||||||||||||||||||||||||||||||||||||||||||||||||||||||||||||||||||||||||||||||||||||||||||||||||||||||||||||||||||||||||||||||||||||||||||||||||||
| ||||||||||||||||||||||||||||||||||||||||||||||||||||||||||||||||||||||||||||||||||||||||||||||||||||||||||||||||||||||||||||||||||||||||||||||||||||||||||||||||||||||||||||||||||||||||||||||||||||||||||||||||||||||||||||||||||||||||||||||||||||||||||||||||||||||||||||||||||||||||||||||||||||||||||||||||||||||||||||||||||||||||||||||||||||||||||||||||||||||||||||||
| George NevettDEF | 22 | 180 | 7.28 | 0 | 0 | 0.0 | 0.0 | 0.01 | 00 | 00 | 0 | 0– | 81% | 11 | 436% | 120 | 1 | 0 | 4 | 18 | 427% | 330% | – | – | ||||||||||||||||||||||||||||||||||||||||||||||||||||||||||||||||||||||||||||||||||||||||||||||||||||||||||||||||||||||||||||||||||||||||||||||||||||||||||||||||||||||||||||||||||||||||||||||||||||||||||||||||||||||||||||||||||||||||||||||||||||||||||||||||||||||||||||||||||||||||||||||||||||||||||||||||||||||||||||||||||||||||||||||||||||||
| ||||||||||||||||||||||||||||||||||||||||||||||||||||||||||||||||||||||||||||||||||||||||||||||||||||||||||||||||||||||||||||||||||||||||||||||||||||||||||||||||||||||||||||||||||||||||||||||||||||||||||||||||||||||||||||||||||||||||||||||||||||||||||||||||||||||||||||||||||||||||||||||||||||||||||||||||||||||||||||||||||||||||||||||||||||||||||||||||||||||||||||||
| Evan WeirDEF | 52 | 198 | 7.02 | 0 | 0 | 0.1 | 0.1 | 0.07 | 21 | 00 | 3 | 150% | 73% | 23 | 431% | 173 | 5 | 2 | 12 | 10 | 1864% | 764% | – | – | ||||||||||||||||||||||||||||||||||||||||||||||||||||||||||||||||||||||||||||||||||||||||||||||||||||||||||||||||||||||||||||||||||||||||||||||||||||||||||||||||||||||||||||||||||||||||||||||||||||||||||||||||||||||||||||||||||||||||||||||||||||||||||||||||||||||||||||||||||||||||||||||||||||||||||||||||||||||||||||||||||||||||||||||||||||||
| ||||||||||||||||||||||||||||||||||||||||||||||||||||||||||||||||||||||||||||||||||||||||||||||||||||||||||||||||||||||||||||||||||||||||||||||||||||||||||||||||||||||||||||||||||||||||||||||||||||||||||||||||||||||||||||||||||||||||||||||||||||||||||||||||||||||||||||||||||||||||||||||||||||||||||||||||||||||||||||||||||||||||||||||||||||||||||||||||||||||||||||||
| Declan FrithFWD | 30 | 61 | 6.47 | 0 | 0 | 0.1 | 0.3 | 0.58 | 20 | 31 | 3 | 571% | 63% | 4 | 00% | 44 | 2 | 0 | 2 | 0 | 867% | 00% | – | – | ||||||||||||||||||||||||||||||||||||||||||||||||||||||||||||||||||||||||||||||||||||||||||||||||||||||||||||||||||||||||||||||||||||||||||||||||||||||||||||||||||||||||||||||||||||||||||||||||||||||||||||||||||||||||||||||||||||||||||||||||||||||||||||||||||||||||||||||||||||||||||||||||||||||||||||||||||||||||||||||||||||||||||||||||||||||
| ||||||||||||||||||||||||||||||||||||||||||||||||||||||||||||||||||||||||||||||||||||||||||||||||||||||||||||||||||||||||||||||||||||||||||||||||||||||||||||||||||||||||||||||||||||||||||||||||||||||||||||||||||||||||||||||||||||||||||||||||||||||||||||||||||||||||||||||||||||||||||||||||||||||||||||||||||||||||||||||||||||||||||||||||||||||||||||||||||||||||||||||
| Sam HughesDEF | 10 | 24 | 6.46 | 0 | 0 | 0.1 | 0.0 | 0.23 | 10 | 00 | 2 | 0– | 88% | 3 | 375% | 32 | 0 | 0 | 2 | 1 | 3100% | 3100% | – | – | ||||||||||||||||||||||||||||||||||||||||||||||||||||||||||||||||||||||||||||||||||||||||||||||||||||||||||||||||||||||||||||||||||||||||||||||||||||||||||||||||||||||||||||||||||||||||||||||||||||||||||||||||||||||||||||||||||||||||||||||||||||||||||||||||||||||||||||||||||||||||||||||||||||||||||||||||||||||||||||||||||||||||||||||||||||||
| ||||||||||||||||||||||||||||||||||||||||||||||||||||||||||||||||||||||||||||||||||||||||||||||||||||||||||||||||||||||||||||||||||||||||||||||||||||||||||||||||||||||||||||||||||||||||||||||||||||||||||||||||||||||||||||||||||||||||||||||||||||||||||||||||||||||||||||||||||||||||||||||||||||||||||||||||||||||||||||||||||||||||||||||||||||||||||||||||||||||||||||||
| Christopher Conn-ClarkeMID | 100 | 162 | 6.30 | 1 | 0 | 0.3 | 1.2 | 0.84 | 82 | 42 | 11 | 764% | 87% | 11 | 233% | 162 | 3 | 1 | 14 | 1 | 2043% | 00% | – | – | ||||||||||||||||||||||||||||||||||||||||||||||||||||||||||||||||||||||||||||||||||||||||||||||||||||||||||||||||||||||||||||||||||||||||||||||||||||||||||||||||||||||||||||||||||||||||||||||||||||||||||||||||||||||||||||||||||||||||||||||||||||||||||||||||||||||||||||||||||||||||||||||||||||||||||||||||||||||||||||||||||||||||||||||||||||||
| ||||||||||||||||||||||||||||||||||||||||||||||||||||||||||||||||||||||||||||||||||||||||||||||||||||||||||||||||||||||||||||||||||||||||||||||||||||||||||||||||||||||||||||||||||||||||||||||||||||||||||||||||||||||||||||||||||||||||||||||||||||||||||||||||||||||||||||||||||||||||||||||||||||||||||||||||||||||||||||||||||||||||||||||||||||||||||||||||||||||||||||||
| Matthew GarbettMID | 50 | 175 | 6.29 | 1 | 0 | 0.7 | 0.2 | 0.45 | 63 | 20 | 3 | 338% | 68% | 9 | 250% | 108 | 1 | 2 | 6 | 3 | 931% | 229% | – | – | ||||||||||||||||||||||||||||||||||||||||||||||||||||||||||||||||||||||||||||||||||||||||||||||||||||||||||||||||||||||||||||||||||||||||||||||||||||||||||||||||||||||||||||||||||||||||||||||||||||||||||||||||||||||||||||||||||||||||||||||||||||||||||||||||||||||||||||||||||||||||||||||||||||||||||||||||||||||||||||||||||||||||||||||||||||||
| ||||||||||||||||||||||||||||||||||||||||||||||||||||||||||||||||||||||||||||||||||||||||||||||||||||||||||||||||||||||||||||||||||||||||||||||||||||||||||||||||||||||||||||||||||||||||||||||||||||||||||||||||||||||||||||||||||||||||||||||||||||||||||||||||||||||||||||||||||||||||||||||||||||||||||||||||||||||||||||||||||||||||||||||||||||||||||||||||||||||||||||||
| Thomas O'ConnorDEF | 77 | 480 | 6.28 | 0 | 0 | 0.0 | 0.1 | 0.01 | 00 | 00 | 1 | 1100% | 84% | 41 | 1742% | 406 | 3 | 2 | 17 | 36 | 3162% | 2059% | – | – | ||||||||||||||||||||||||||||||||||||||||||||||||||||||||||||||||||||||||||||||||||||||||||||||||||||||||||||||||||||||||||||||||||||||||||||||||||||||||||||||||||||||||||||||||||||||||||||||||||||||||||||||||||||||||||||||||||||||||||||||||||||||||||||||||||||||||||||||||||||||||||||||||||||||||||||||||||||||||||||||||||||||||||||||||||||||
| ||||||||||||||||||||||||||||||||||||||||||||||||||||||||||||||||||||||||||||||||||||||||||||||||||||||||||||||||||||||||||||||||||||||||||||||||||||||||||||||||||||||||||||||||||||||||||||||||||||||||||||||||||||||||||||||||||||||||||||||||||||||||||||||||||||||||||||||||||||||||||||||||||||||||||||||||||||||||||||||||||||||||||||||||||||||||||||||||||||||||||||||
| Eddie FoxFWD | 10 | 22 | 6.19 | 0 | 0 | 0.0 | 0.0 | 0.00 | 00 | 20 | 0 | 0– | 95% | 2 | 0– | 27 | 2 | 0 | 1 | 2 | 4100% | 1100% | – | – | ||||||||||||||||||||||||||||||||||||||||||||||||||||||||||||||||||||||||||||||||||||||||||||||||||||||||||||||||||||||||||||||||||||||||||||||||||||||||||||||||||||||||||||||||||||||||||||||||||||||||||||||||||||||||||||||||||||||||||||||||||||||||||||||||||||||||||||||||||||||||||||||||||||||||||||||||||||||||||||||||||||||||||||||||||||||
| ||||||||||||||||||||||||||||||||||||||||||||||||||||||||||||||||||||||||||||||||||||||||||||||||||||||||||||||||||||||||||||||||||||||||||||||||||||||||||||||||||||||||||||||||||||||||||||||||||||||||||||||||||||||||||||||||||||||||||||||||||||||||||||||||||||||||||||||||||||||||||||||||||||||||||||||||||||||||||||||||||||||||||||||||||||||||||||||||||||||||||||||
| Vernon MasaraFWD | 94 | 282 | 6.13 | 1 | 0 | 1.0 | 0.3 | 0.42 | 102 | 40 | 18 | 222% | 73% | 8 | 133% | 110 | 3 | 0 | 5 | 2 | 1231% | 222% | – | – | ||||||||||||||||||||||||||||||||||||||||||||||||||||||||||||||||||||||||||||||||||||||||||||||||||||||||||||||||||||||||||||||||||||||||||||||||||||||||||||||||||||||||||||||||||||||||||||||||||||||||||||||||||||||||||||||||||||||||||||||||||||||||||||||||||||||||||||||||||||||||||||||||||||||||||||||||||||||||||||||||||||||||||||||||||||||
| ||||||||||||||||||||||||||||||||||||||||||||||||||||||||||||||||||||||||||||||||||||||||||||||||||||||||||||||||||||||||||||||||||||||||||||||||||||||||||||||||||||||||||||||||||||||||||||||||||||||||||||||||||||||||||||||||||||||||||||||||||||||||||||||||||||||||||||||||||||||||||||||||||||||||||||||||||||||||||||||||||||||||||||||||||||||||||||||||||||||||||||||
| David KamaraFWD | 20 | 28 | 5.98 | 0 | 0 | 0.4 | 0.0 | 1.38 | 11 | 00 | 1 | 00% | 0% | 1 | 0– | 6 | 0 | 0 | 2 | 0 | 00% | 00% | – | – | ||||||||||||||||||||||||||||||||||||||||||||||||||||||||||||||||||||||||||||||||||||||||||||||||||||||||||||||||||||||||||||||||||||||||||||||||||||||||||||||||||||||||||||||||||||||||||||||||||||||||||||||||||||||||||||||||||||||||||||||||||||||||||||||||||||||||||||||||||||||||||||||||||||||||||||||||||||||||||||||||||||||||||||||||||||||
| ||||||||||||||||||||||||||||||||||||||||||||||||||||||||||||||||||||||||||||||||||||||||||||||||||||||||||||||||||||||||||||||||||||||||||||||||||||||||||||||||||||||||||||||||||||||||||||||||||||||||||||||||||||||||||||||||||||||||||||||||||||||||||||||||||||||||||||||||||||||||||||||||||||||||||||||||||||||||||||||||||||||||||||||||||||||||||||||||||||||||||||||
League and cup games this season. Ratings are averaged by minutes played. Faded rows have played too little to rank. Small figures: starts, shots on target, big chances, success rates and clean sheets. Tap a heading to sort.
League One · as of Sun 1 Nov 2026
Where we stand
The live League One table. Posh highlighted; lines mark automatic promotion, the play-offs and the drop.
| # | Team | P | GD | Pts |
|---|---|---|---|---|
| 1 | Huddersfield | 13 | +16 | 28 |
| 2 | Stockport County | 14 | +12 | 26 |
| 3 | Oxford Utd | 12 | +9 | 23 |
| 4 | Luton | 13 | +6 | 23 |
| 5 | Plymouth | 14 | +2 | 23 |
| 6 | Reading | 13 | +12 | 22 |
| 7 | Bradford | 13 | +2 | 22 |
| 8 | Cambridge | 14 | +0 | 21 |
| 9 | Sheff Wed | 13 | +8 | 20 |
| 10 | Leicester | 13 | +3 | 19 |
| 11 | MK Dons | 13 | +2 | 18 |
| 12 | Mansfield | 12 | +2 | 18 |
| 13 | Wycombe | 13 | -2 | 18 |
| 14 | Leyton Orient | 13 | +5 | 17 |
| 15 | Burton | 14 | -3 | 17 |
| 16 | Stevenage | 12 | +4 | 16 |
| 17 | Notts County | 12 | -1 | 14 |
| 18 | Wimbledon | 13 | -12 | 13 |
| 19 | Blackpool | 12 | -4 | 12 |
| 20 | Doncaster | 13 | -8 | 12 |
| 21 | Wigan | 13 | -11 | 10 |
| 22 | Peterborough | 13 | -12 | 10 |
| 23 | Barnsley | 12 | -10 | 9 |
| 24 | Bromley | 13 | -20 | 9 |
in the drop zone, 2 pts from safety
6 of 23 rivals have a game in handLive tracker
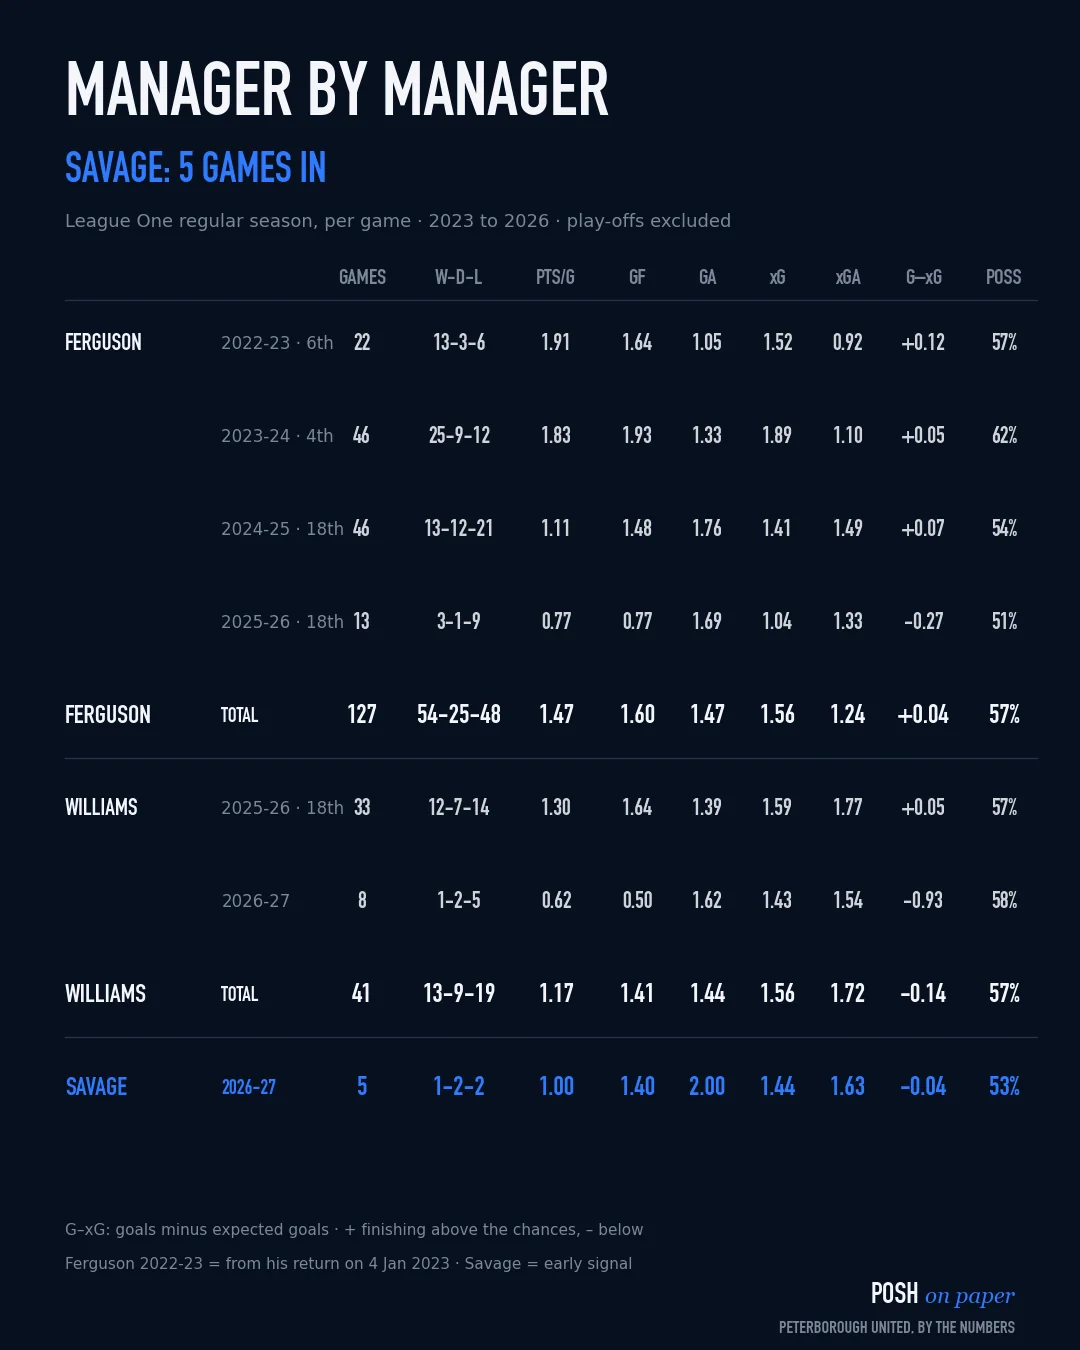
The Savage Shift
Per-game League One averages: Luke Williams' whole spell (41 games) against Robbie Savage so far (5 games). Updated after every match.
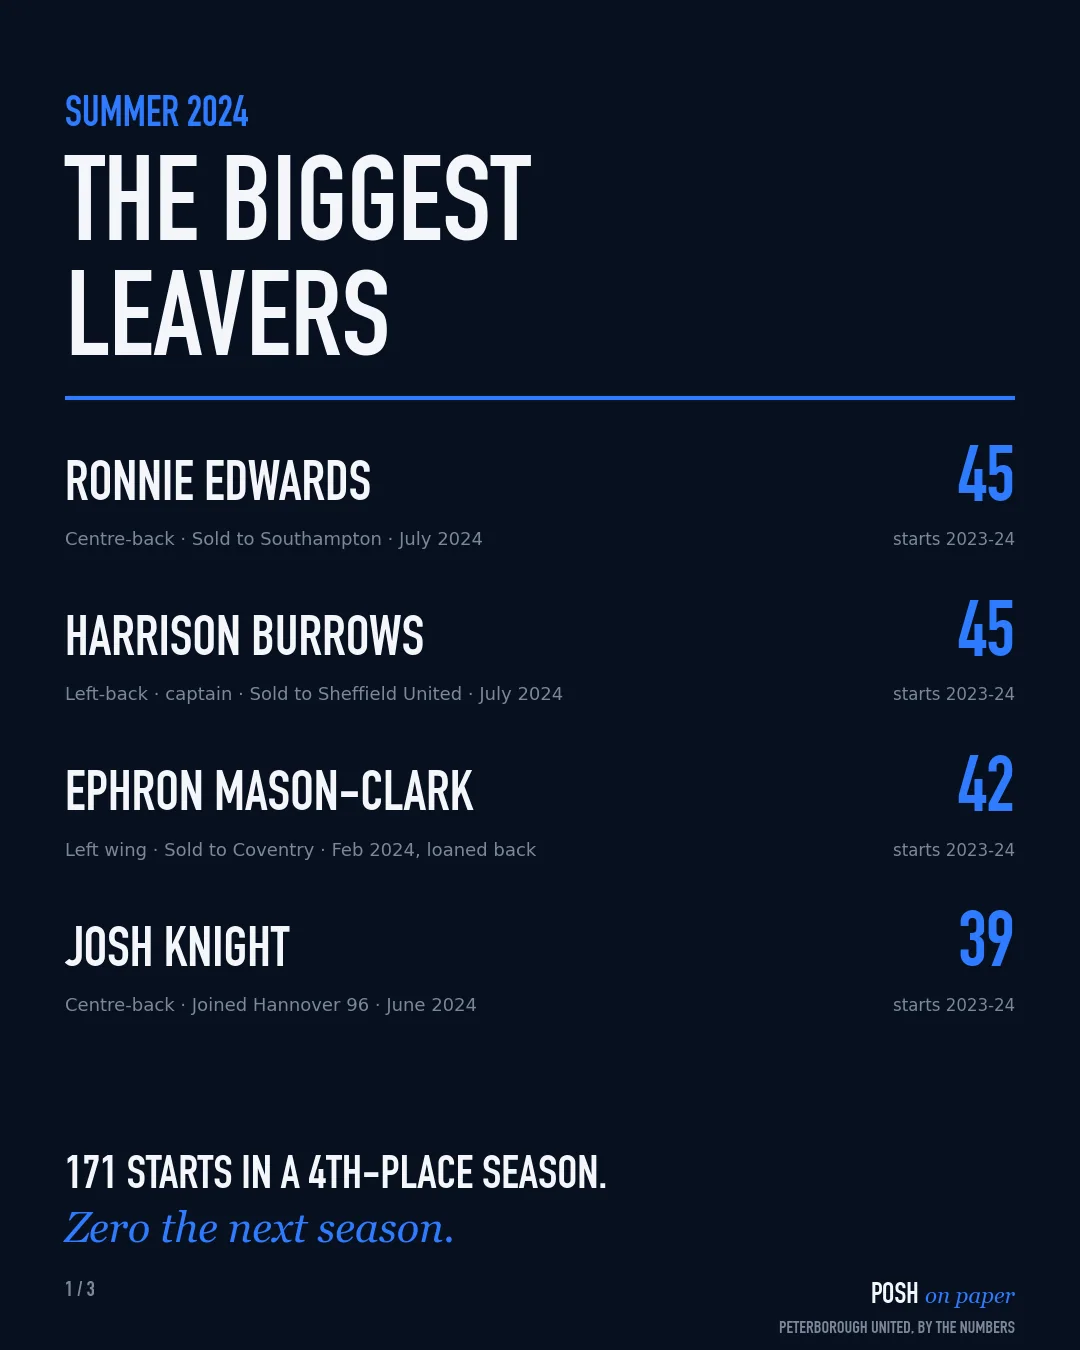
Post · Summer 2024
The biggest leavers
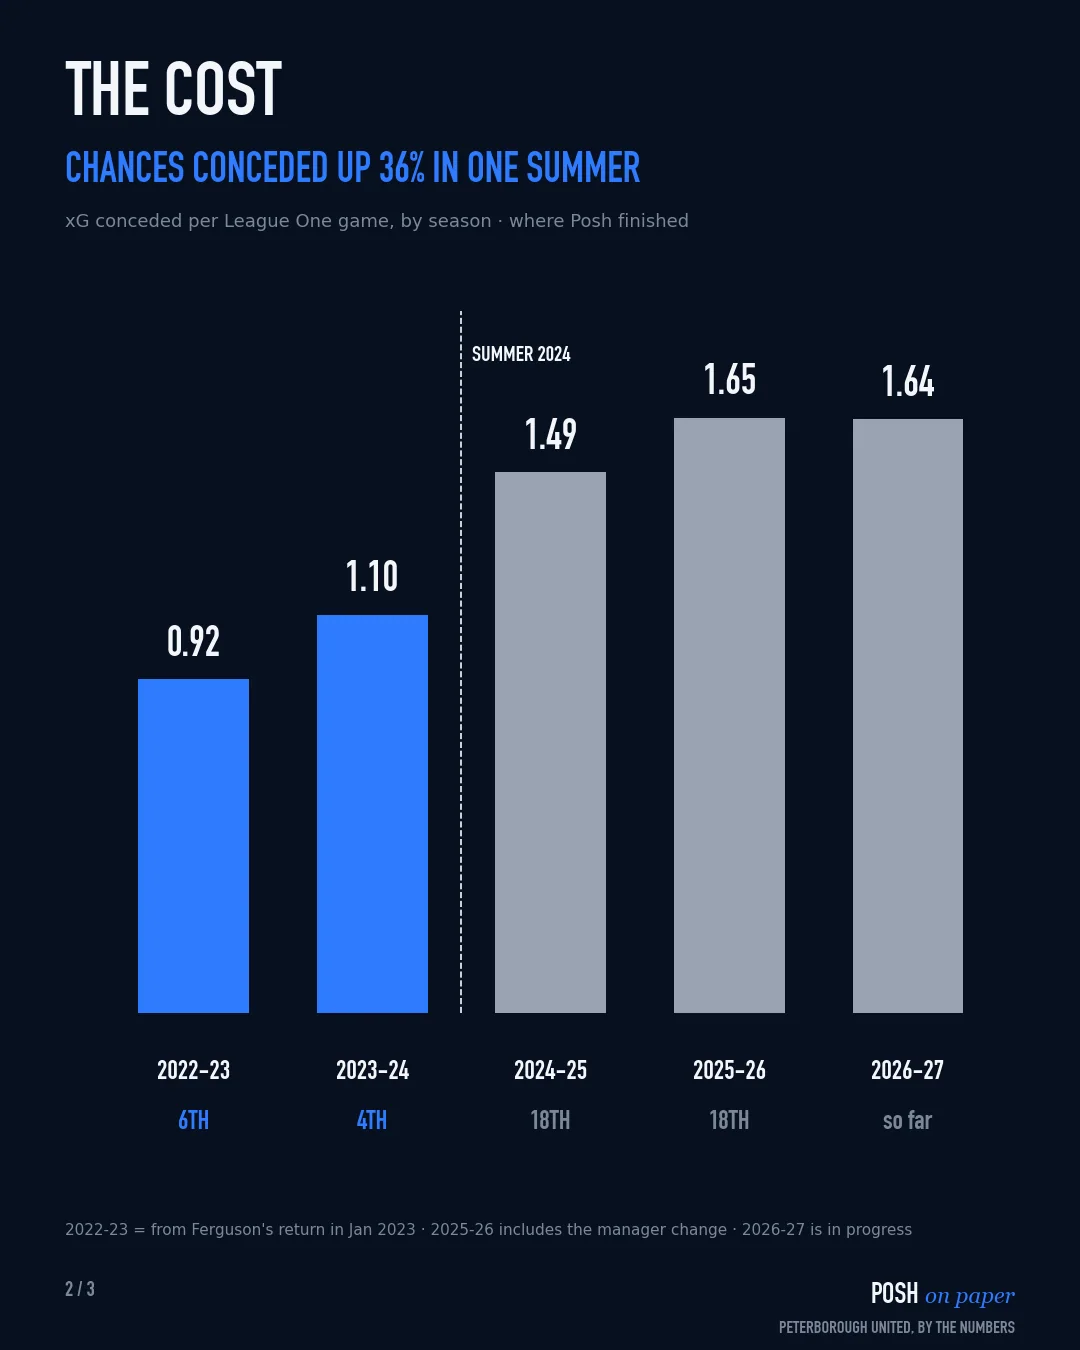
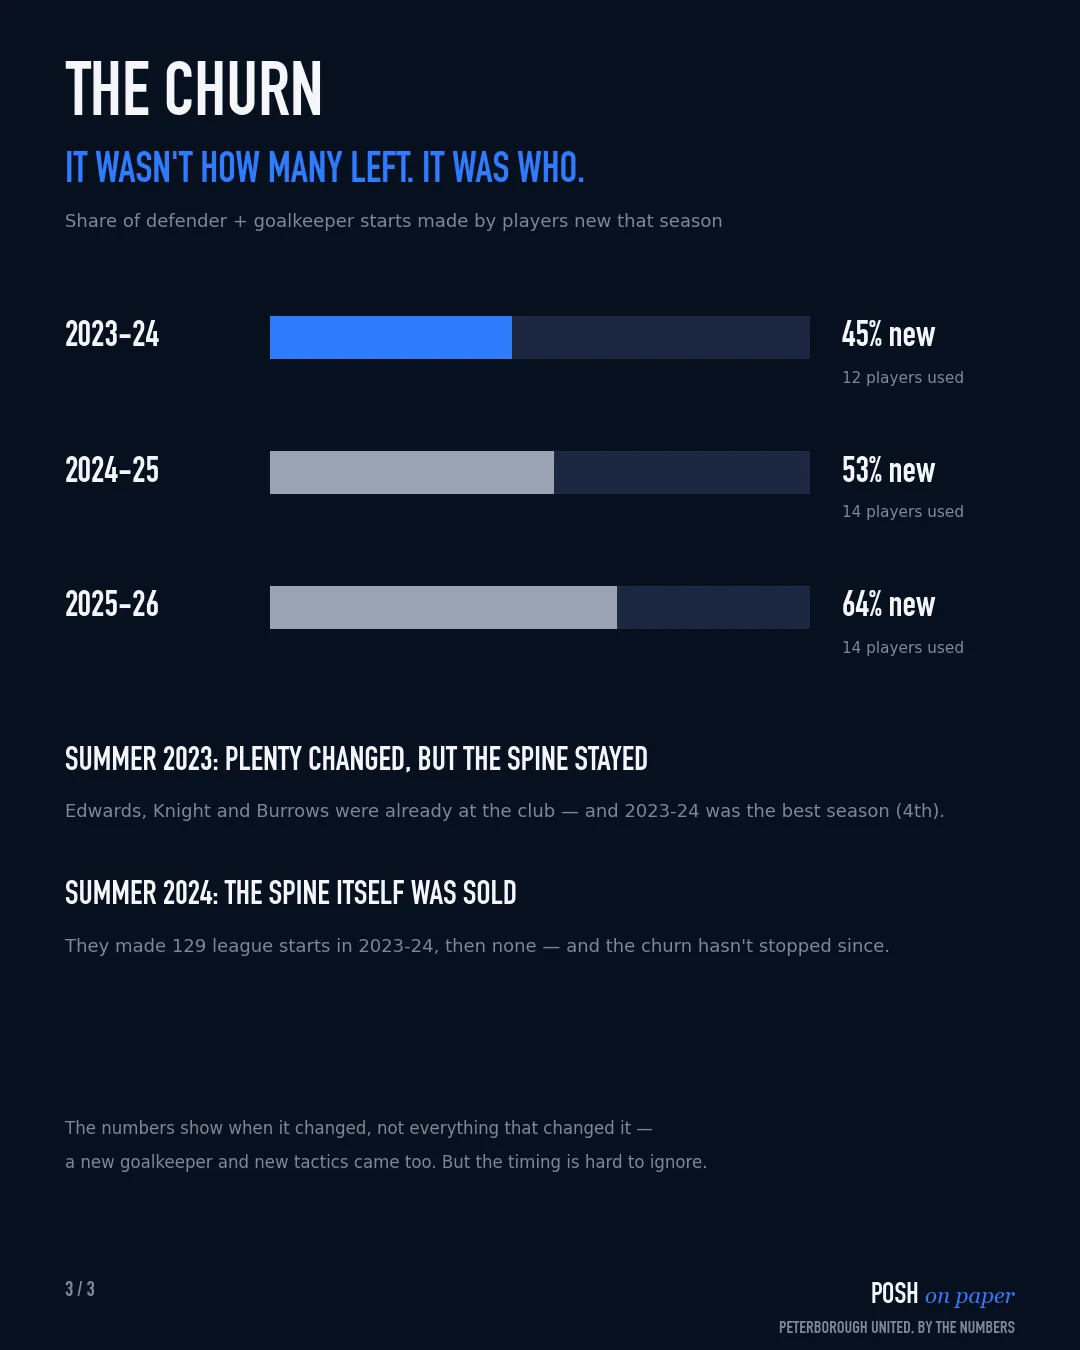
Since January 2023
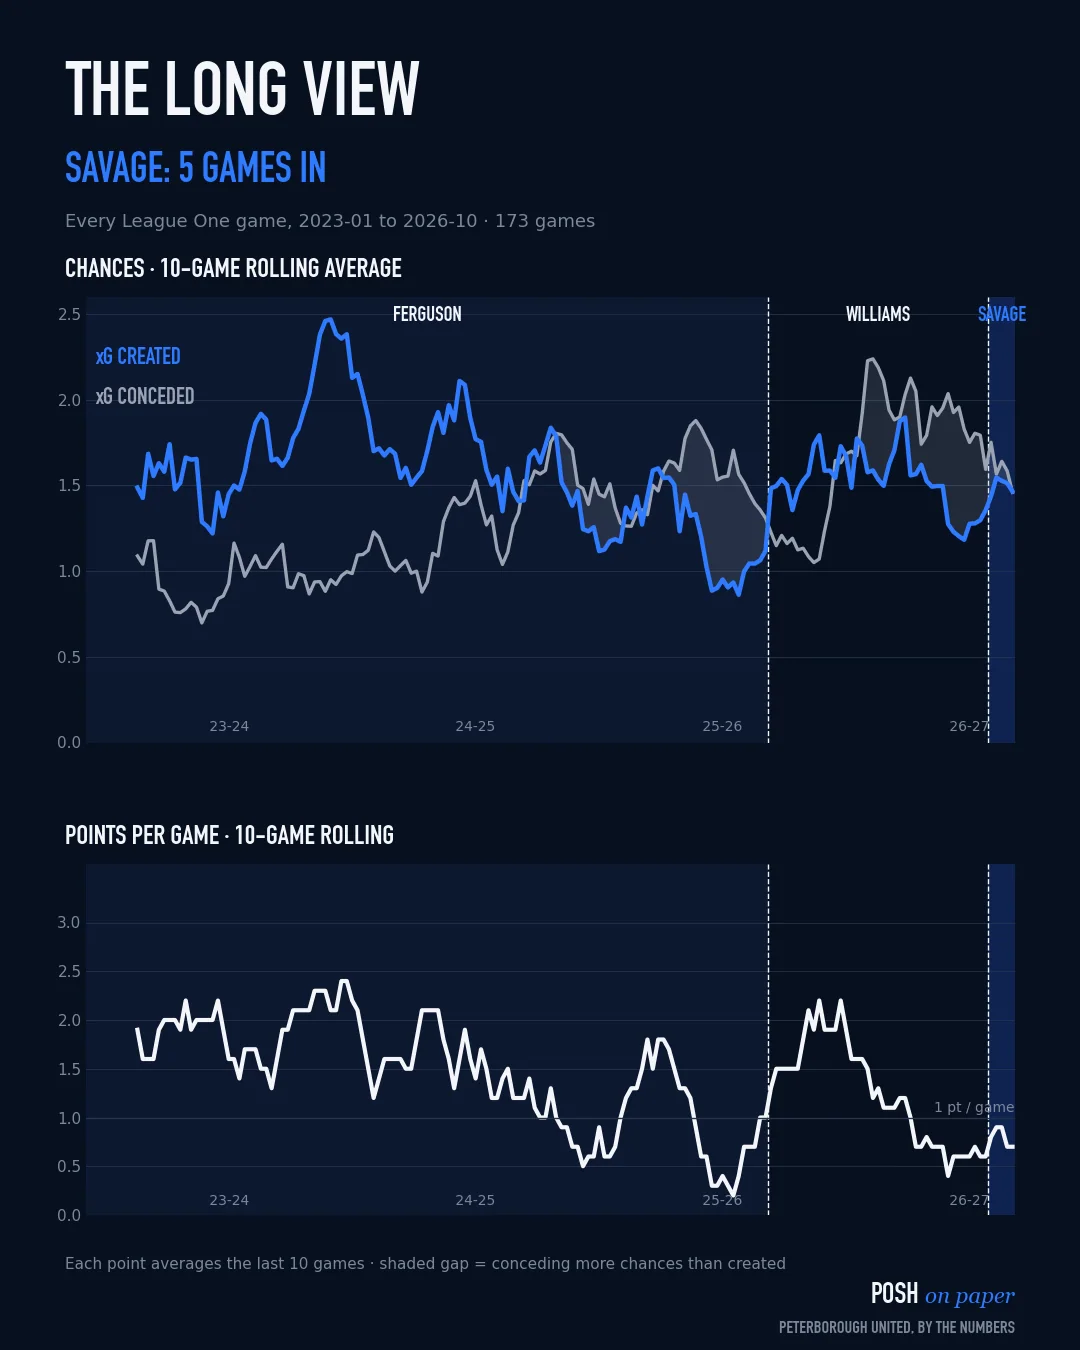
The long view
From 4th with 84 points to 18th: chances conceded jumped in summer 2024 and never fully came back.
Ferguson
Ferguson
Ferguson
Ferguson → Williams
Williams → Savage

The archive
Every game
Every League One and play-off game since Ferguson's return in January 2023. The bar is xG created vs conceded; "on paper" is who the chances said should have won — highlighted when the result went the other way. Scores are shown Posh first.
2026-27
League W2 D4 L7- Robbie Savage
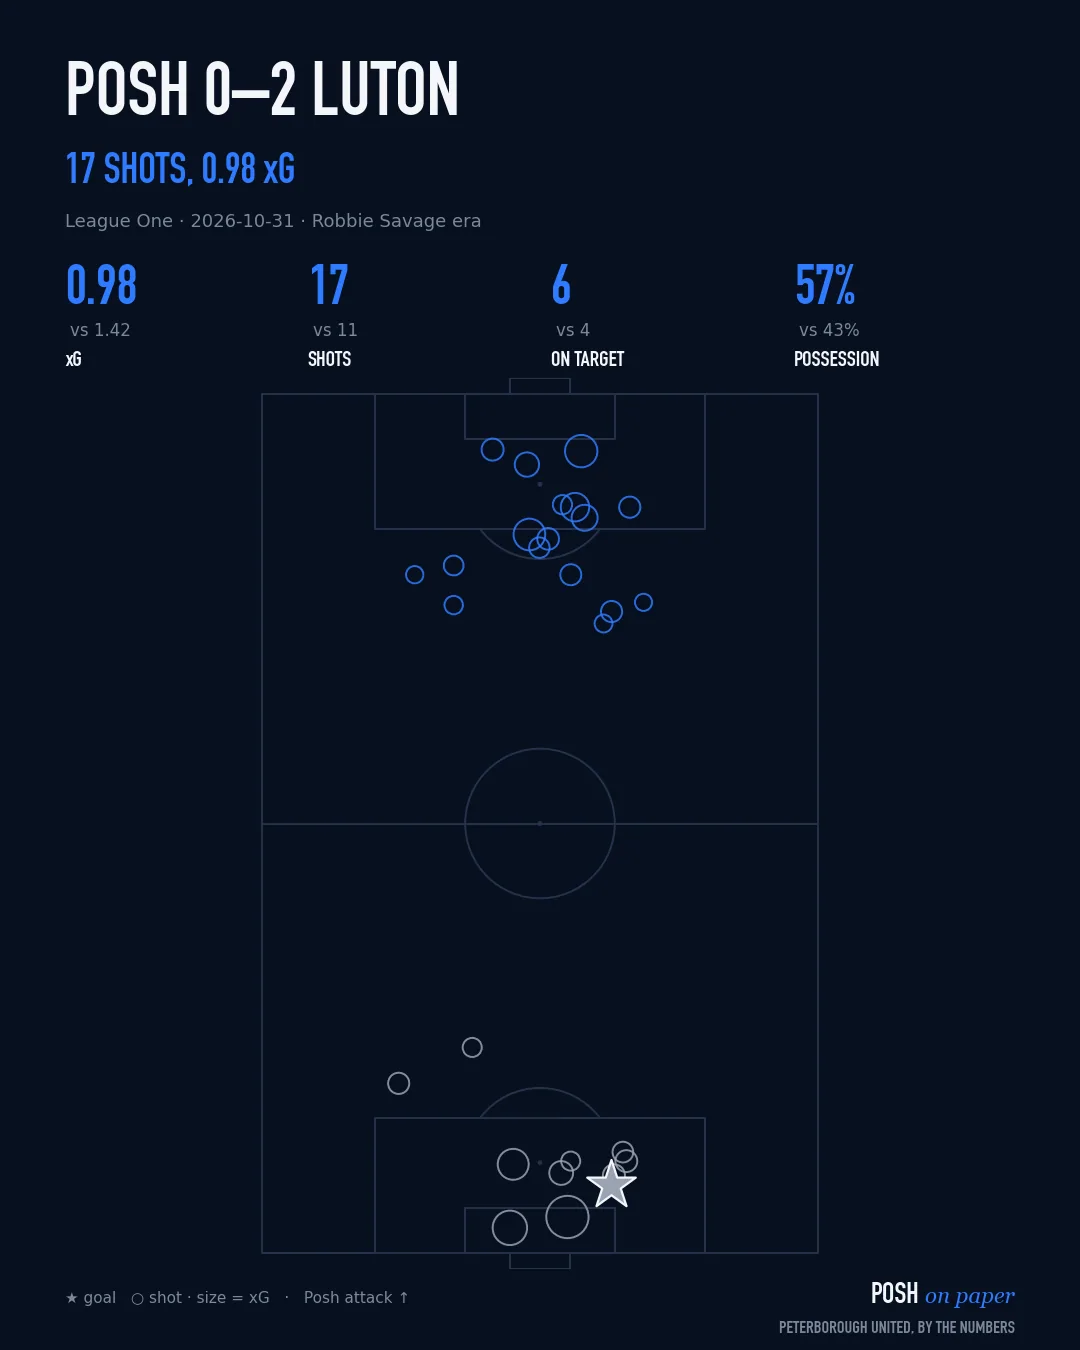
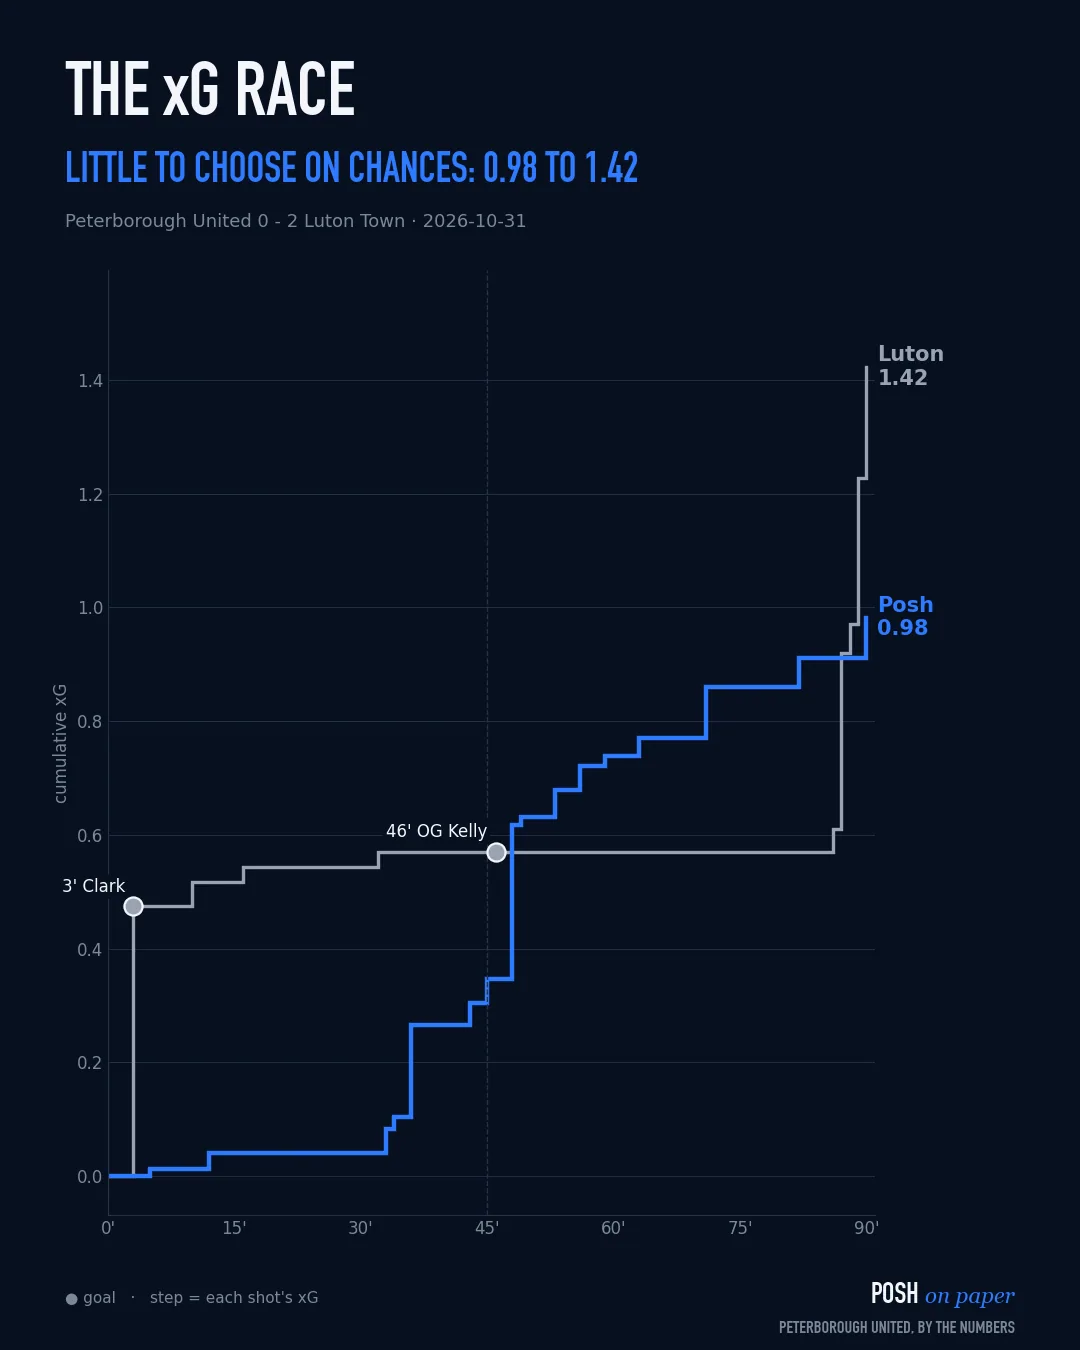
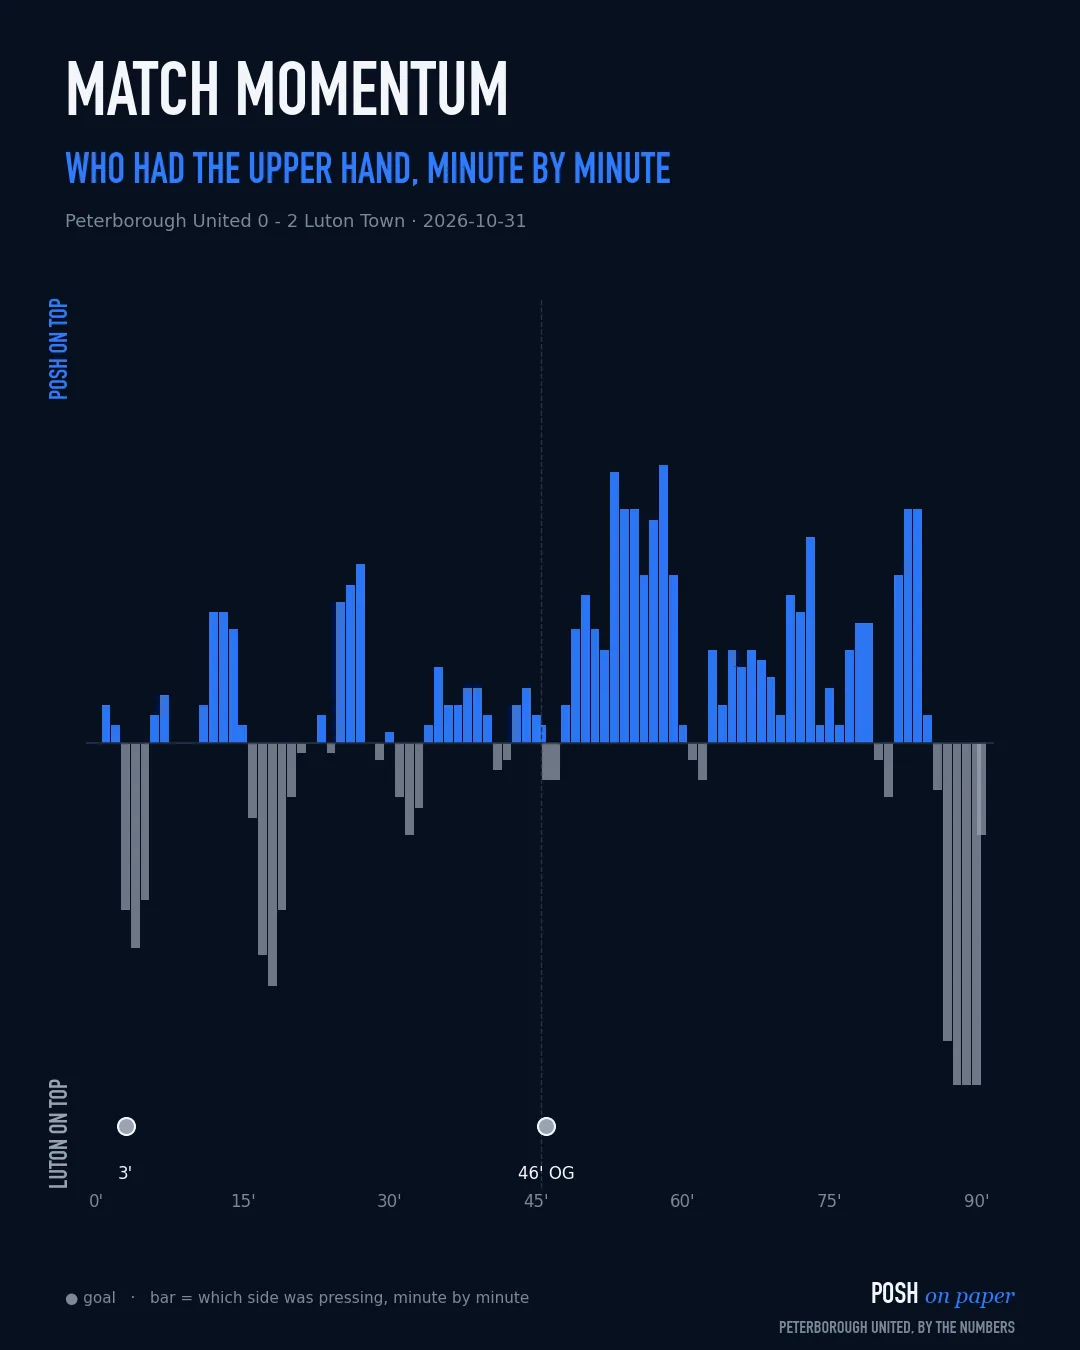
- 31 Oct 26H Luton L0–2 on paper D→
- 24 Oct 26A Bromley D1–1 on paper W→
- 20 Oct 26A Huddersfield L1–4 on paper L→
- 17 Oct 26H Burton D2–2 on paper W→
- 10 Oct 26A Leicester W3–1 on paper L→
- Luke Williams
- 26 Sep 26A Stockport L0–1 on paper D→
- 19 Sep 26H Doncaster L0–2 on paper D→
- 12 Sep 26A MK Dons D1–1 on paper D→
- 5 Sep 26H Sheff Wed L1–2 on paper W→
- 1 Sep 26H Stevenage D0–0 on paper D→
- 29 Aug 26A Blackpool L0–4 on paper L→
- 22 Aug 26H Mansfield W2–1 on paper D→
- 15 Aug 26A Bradford L0–2 on paper L→
2025-26
League W15 D8 L23 · finished 18th- Luke Williams
- 2 May 26H Doncaster L1–3 on paper L→
- 28 Apr 26H Mansfield D0–0 on paper D→
- 25 Apr 26A Stockport L1–3 on paper L→
- 19 Apr 26H Burton D1–1 on paper D→
- 16 Apr 26H Port Vale L1–3 on paper D→
- 11 Apr 26A Blackpool L1–3 on paper L→
- 6 Apr 26H Cardiff D1–1 on paper L→
- 3 Apr 26A Luton L1–2 on paper L→
- 21 Mar 26A Wimbledon D1–1 on paper L→
- 17 Mar 26H Rotherham W5–0 on paper W→
- 14 Mar 26A Leyton Orient L1–2 on paper L→
- 28 Feb 26A Northampton D1–1 on paper L→
- 21 Feb 26H Exeter D3–3 on paper L→
- 17 Feb 26A Barnsley L1–2 on paper W→
- 14 Feb 26A Bradford L0–2 on paper L→
- 10 Feb 26A Mansfield W2–1 on paper L→
- 7 Feb 26H Wigan W6–1 on paper W→
- 31 Jan 26H Huddersfield L2–3 on paper D→
- 27 Jan 26A Stevenage L0–1 on paper L→
- 24 Jan 26A Wycombe W2–0 on paper W→
- 17 Jan 26H Plymouth L0–1 on paper L→
- 10 Jan 26H Bolton W3–1 on paper L→
- 4 Jan 26A Lincoln L2–5 on paper D→
- 1 Jan 26A Rotherham W2–0 on paper W→
- 29 Dec 25H Reading D1–1 on paper W→
- 26 Dec 25H Leyton Orient W1–0 on paper W→
- 20 Dec 25A Port Vale W1–0 on paper D→
- 13 Dec 25H Northampton W2–1 on paper W→
- 9 Dec 25A Reading W2–1 on paper L→
- 29 Nov 25A Doncaster L1–2 on paper L→
- 25 Nov 25H Stevenage L0–1 on paper L→
- 20 Nov 25H Stockport W3–0 on paper D→
- 8 Nov 25H Wimbledon W5–0 on paper W→
- Darren Ferguson
- 25 Oct 25H Blackpool L1–2 on paper W→
- 18 Oct 25A Burton W1–0 on paper L→
- 4 Oct 25A Bolton L1–2 on paper D→
- 27 Sep 25H Lincoln L0–3 on paper D→
- 20 Sep 25A Plymouth W1–0 on paper W→
- 13 Sep 25H Wycombe W2–1 on paper W→
- 6 Sep 25A Huddersfield L2–3 on paper L→
- 30 Aug 25A Exeter L0–3 on paper L→
- 23 Aug 25H Bradford D1–1 on paper L→
- 19 Aug 25H Barnsley L0–1 on paper L→
- 16 Aug 25A Wigan L0–2 on paper D→
- 9 Aug 25H Luton L0–2 on paper L→
- 2 Aug 25A Cardiff L1–2 on paper D→
2024-25
League W13 D12 L21 · finished 18th- Darren Ferguson
- 3 May 25A Rotherham L1–2 on paper L→
- 30 Apr 25A Mansfield L2–4 on paper L→
- 26 Apr 25H Bolton D1–1 on paper D→
- 21 Apr 25A Barnsley D1–1 on paper D→
- 18 Apr 25H Stockport D1–1 on paper D→
- 8 Apr 25H Birmingham L1–2 on paper L→
- 5 Apr 25H Northampton L0–4 on paper L→
- 1 Apr 25A Crawley W4–3 on paper W→
- 29 Mar 25A Reading L1–3 on paper D→
- 22 Mar 25H Charlton W3–0 on paper D→
- 15 Mar 25A Cambridge W1–0 on paper L→
- 8 Mar 25H Wycombe D1–1 on paper W→
- 4 Mar 25A Blackpool D0–0 on paper D→
- 1 Mar 25H Shrewsbury W3–1 on paper W→
- 22 Feb 25A Huddersfield W1–0 on paper D→
- 15 Feb 25A Stevenage D1–1 on paper D→
- 11 Feb 25A Charlton L1–2 on paper L→
- 2 Feb 25A Bristol Rovers L1–3 on paper D→
- 28 Jan 25H Wigan W1–0 on paper D→
- 25 Jan 25A Lincoln L1–5 on paper L→
- 21 Jan 25H Exeter D1–1 on paper W→
- 18 Jan 25H Leyton Orient D0–0 on paper D→
- 4 Jan 25A Wrexham L0–1 on paper D→
- 1 Jan 25A Burton D2–2 on paper D→
- 29 Dec 24H Barnsley L1–3 on paper D→
- 26 Dec 24H Mansfield L0–3 on paper L→
- 20 Dec 24A Stockport L1–2 on paper L→
- 14 Dec 24H Crawley W4–3 on paper D→
- 9 Dec 24A Northampton L1–2 on paper W→
- 4 Dec 24H Burton L0–1 on paper D→
- 23 Nov 24H Reading L1–2 on paper D→
- 9 Nov 24H Cambridge W6–1 on paper W→
- 26 Oct 24A Bolton L0–1 on paper L→
- 22 Oct 24H Blackpool W5–1 on paper D→
- 19 Oct 24A Wycombe L1–3 on paper D→
- 12 Oct 24H Rotherham D3–3 on paper W→
- 5 Oct 24H Stevenage W2–1 on paper D→
- 1 Oct 24A Wigan L0–3 on paper W→
- 28 Sep 24A Birmingham L2–3 on paper D→
- 24 Sep 24A Leyton Orient D2–2 on paper D→
- 21 Sep 24H Bristol Rovers W3–2 on paper W→
- 14 Sep 24H Lincoln D1–1 on paper D→
- 31 Aug 24H Wrexham L0–2 on paper L→
- 24 Aug 24A Exeter W2–1 on paper W→
- 17 Aug 24A Shrewsbury W4–1 on paper W→
- 10 Aug 24H Huddersfield L0–2 on paper L→
2023-24
League W25 D9 L12 · finished 4th- Darren Ferguson
- 8 May 24H OxfordPLAY-OFF D1–1 on paper D→
- 4 May 24A OxfordPLAY-OFF L0–1 on paper D→
- 27 Apr 24H Bolton D3–3 on paper W→
- 23 Apr 24A Cheltenham L0–2 on paper L→
- 20 Apr 24A Bristol Rovers W2–0 on paper W→
- 16 Apr 24H Fleetwood W4–1 on paper W→
- 13 Apr 24A Oxford L0–5 on paper L→
- 10 Apr 24H Port Vale W3–0 on paper W→
- 1 Apr 24A Leyton Orient W2–1 on paper W→
- 29 Mar 24H Carlisle L1–3 on paper W→
- 16 Mar 24H Portsmouth L0–1 on paper D→
- 13 Mar 24H Stevenage W3–1 on paper D→
- 9 Mar 24A Burton W3–1 on paper D→
- 5 Mar 24H Northampton W5–1 on paper W→
- 2 Mar 24H Exeter W2–1 on paper D→
- 24 Feb 24A Cambridge W1–0 on paper W→
- 17 Feb 24H Blackpool L1–2 on paper L→
- 10 Feb 24A Wycombe L2–5 on paper D→
- 6 Feb 24A Exeter L1–2 on paper W→
- 3 Feb 24H Wigan L2–3 on paper W→
- 27 Jan 24A Lincoln D0–0 on paper D→
- 20 Jan 24H Shrewsbury W2–1 on paper W→
- 13 Jan 24A Charlton W2–1 on paper D→
- 1 Jan 24A Derby W3–2 on paper D→
- 29 Dec 23H Barnsley D2–2 on paper D→
- 26 Dec 23H Reading D2–2 on paper D→
- 23 Dec 23A Shrewsbury W2–1 on paper W→
- 16 Dec 23A Fleetwood W1–0 on paper W→
- 9 Dec 23H Oxford W3–0 on paper W→
- 28 Nov 23A Stevenage D2–2 on paper W→
- 25 Nov 23H Burton W4–0 on paper W→
- 11 Nov 23H Cambridge W5–0 on paper W→
- 7 Nov 23A Wigan L1–2 on paper W→
- 28 Oct 23A Blackpool W4–2 on paper W→
- 24 Oct 23A Port Vale W1–0 on paper D→
- 21 Oct 23H Wycombe D2–2 on paper L→
- 7 Oct 23H Lincoln W2–0 on paper D→
- 3 Oct 23A Carlisle D1–1 on paper W→
- 30 Sep 23H Bristol Rovers W2–0 on paper W→
- 23 Sep 23A Bolton D1–1 on paper W→
- 19 Sep 23H Cheltenham W3–0 on paper W→
- 16 Sep 23H Leyton Orient D1–1 on paper W→
- 2 Sep 23A Portsmouth L1–3 on paper L→
- 26 Aug 23H Derby L2–4 on paper W→
- 19 Aug 23A Northampton L0–1 on paper W→
- 15 Aug 23A Barnsley W3–1 on paper W→
- 12 Aug 23H Charlton W1–0 on paper D→
- 5 Aug 23A Reading W1–0 on paper L→
2022-23
League W13 D3 L6 · finished 6th- Darren Ferguson
- 18 May 23A Sheff WedPLAY-OFF L1–5 on paper L→
- 12 May 23H Sheff WedPLAY-OFF W4–0 on paper W→
- 7 May 23A Barnsley W2–0 on paper D→
- 29 Apr 23H Bristol Rovers D0–0 on paper W→
- 22 Apr 23H Ipswich L0–3 on paper D→
- 18 Apr 23A Accrington W2–1 on paper D→
- 15 Apr 23A Cambridge L0–2 on paper D→
- 10 Apr 23H Exeter W3–1 on paper W→
- 7 Apr 23A Shrewsbury W3–0 on paper W→
- 1 Apr 23H Oxford D0–0 on paper D→
- 25 Mar 23H Derby W2–0 on paper W→
- 18 Mar 23A Lincoln W3–0 on paper D→
- 14 Mar 23A Burton W5–2 on paper W→
- 11 Mar 23H Cheltenham L0–3 on paper W→
- 7 Mar 23H Shrewsbury W2–1 on paper W→
- 4 Mar 23A Sheff Wed L0–1 on paper L→
- 28 Feb 23H Charlton D0–0 on paper L→
- 25 Feb 23H Plymouth W5–2 on paper W→
- 18 Feb 23A Morecambe W3–0 on paper D→
- 14 Feb 23A Fleetwood L0–1 on paper W→
- 11 Feb 23H Bolton L0–5 on paper L→
- 4 Feb 23A Forest Green W2–0 on paper W→
- 28 Jan 23H Portsmouth W2–1 on paper W→
- 16 Jan 23A Port Vale W2–0 on paper W→
How to read it
On paper
xG (expected goals) rates every shot by how often a chance like it is scored. Add them up and you get the quality of chances a team created — a better guide to performance than the score alone.
On paper is our verdict: if one side created at least 0.5 xG more, they "should have won". When the result disagrees, that's luck, finishing or goalkeeping — and usually the story.
Counter-attack shots are shots from fast breaks. Passes in the opposition half is the share of Posh passes played in the other team's half — how high and direct they play.
The Savage Shift compares per-game averages under Robbie Savage with Luke Williams' whole spell. Percentages change in points (57% → 30% is −27 pts).